

Resource Histogram
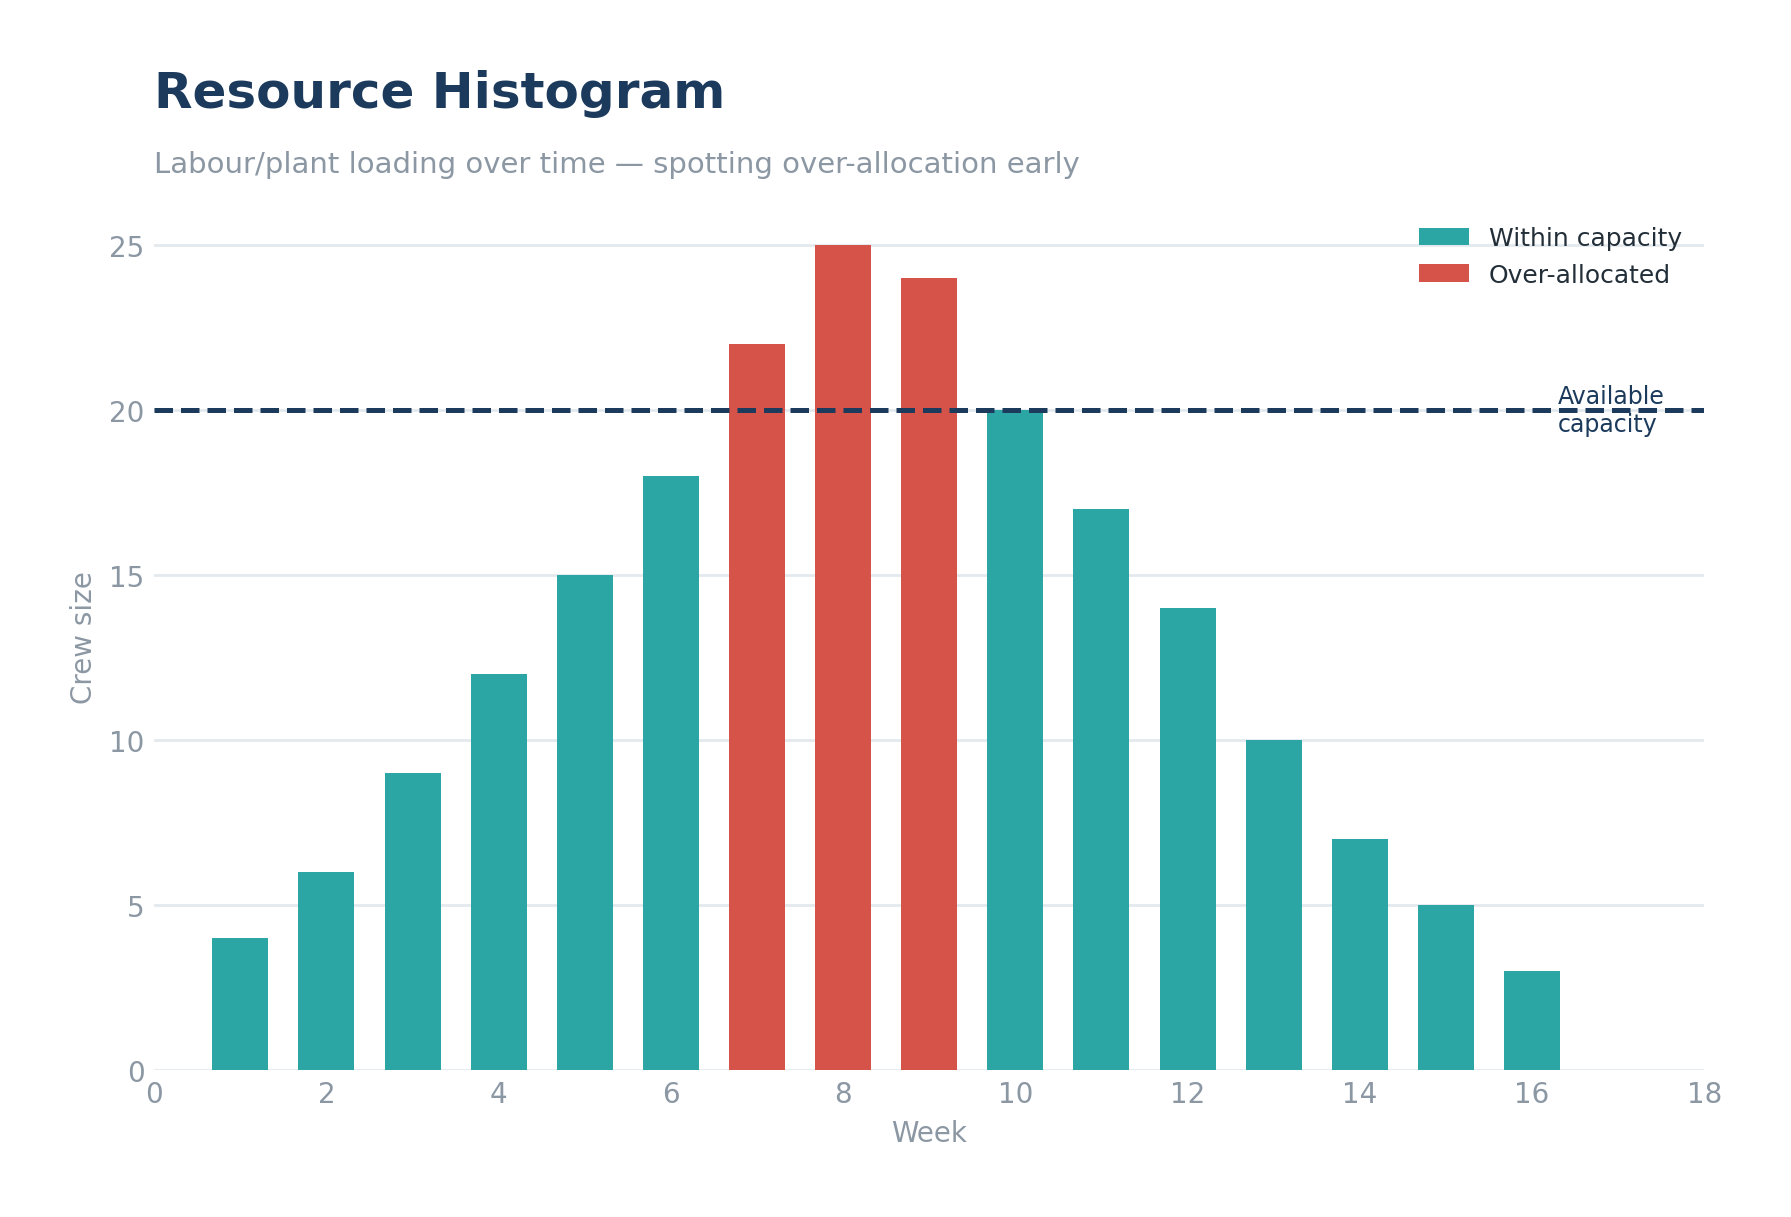
A visual chart showing how your labour, plant, or equipment resources are loaded across the life of the project — making it easy to spot over-allocation, gaps, or unrealistic peaks at a glance.
Why it matters
A schedule can look perfectly logical on paper and still be undeliverable if it assumes resource levels you can’t actually mobilise — whether that’s tradespeople on a mine site, specialist offshore crews within a limited bed count, or subcontractor trades on a commercial build. A resource histogram exposes those problems before they become site problems, and it’s often required by clients as part of tender or baseline submissions to demonstrate your programme is resourced realistically.
What's included in our deliverable
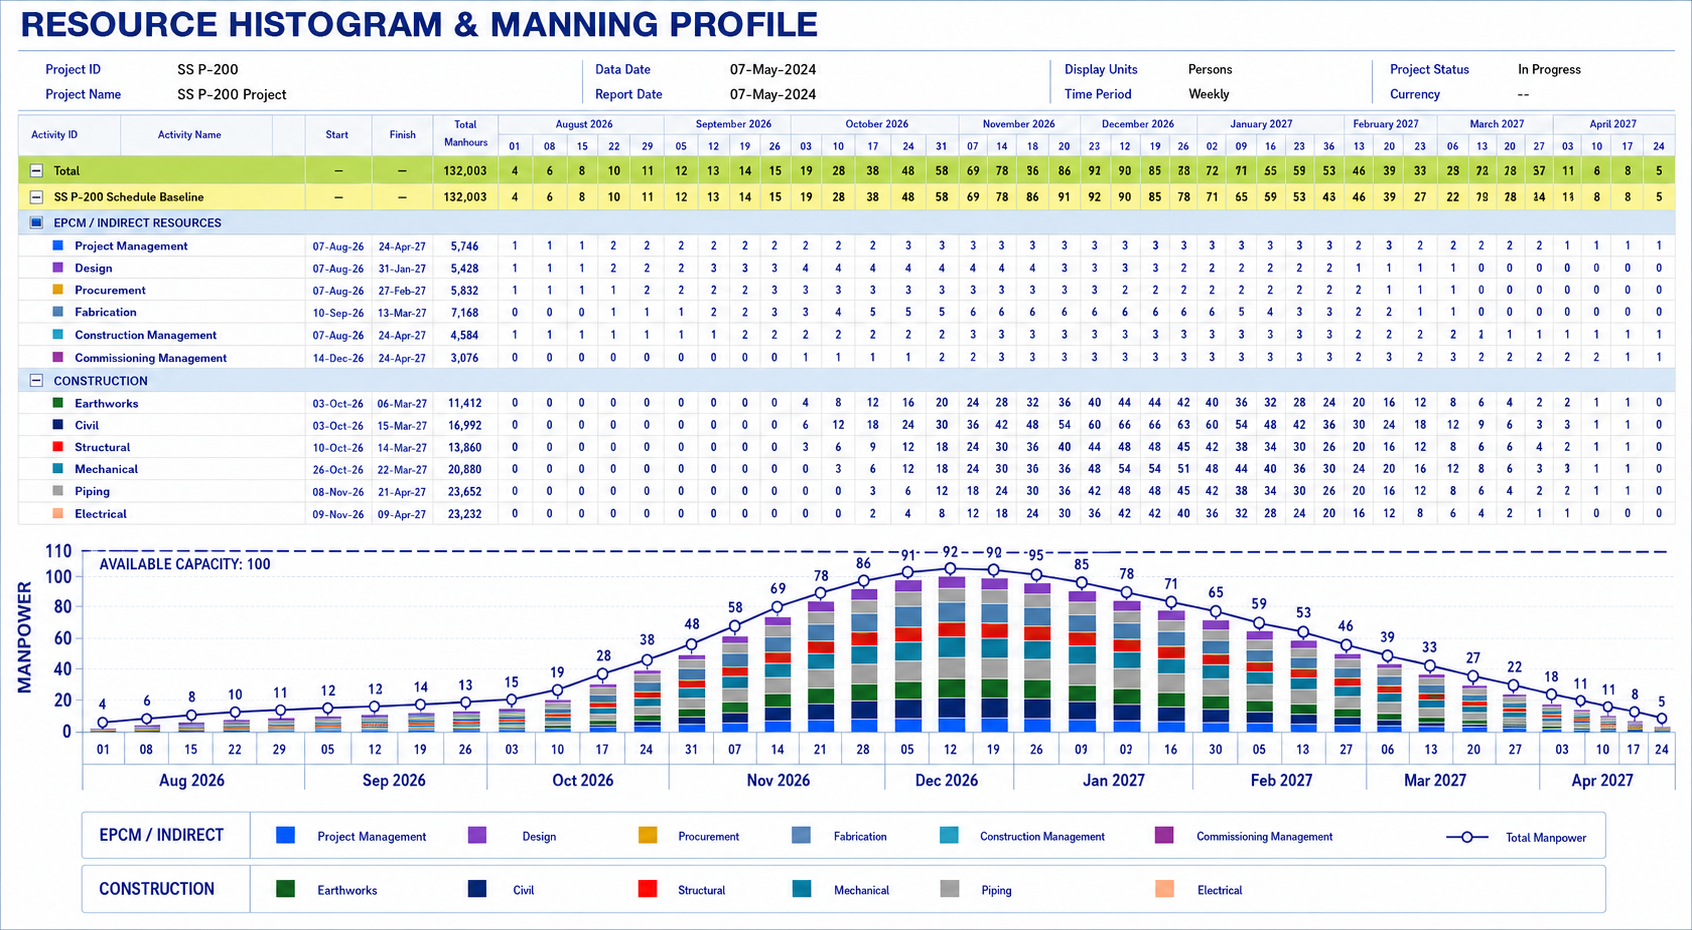
- Resource-loaded schedule with histogram output by trade, discipline, or resource type
- Identification of peak demand periods and potential over-allocation
- Comparison against your actual workforce/plant availability plan
When to use it
At tender and baseline stage to validate deliverability, and periodically through construction to manage resource planning.