

S Curves & Progress Measurement
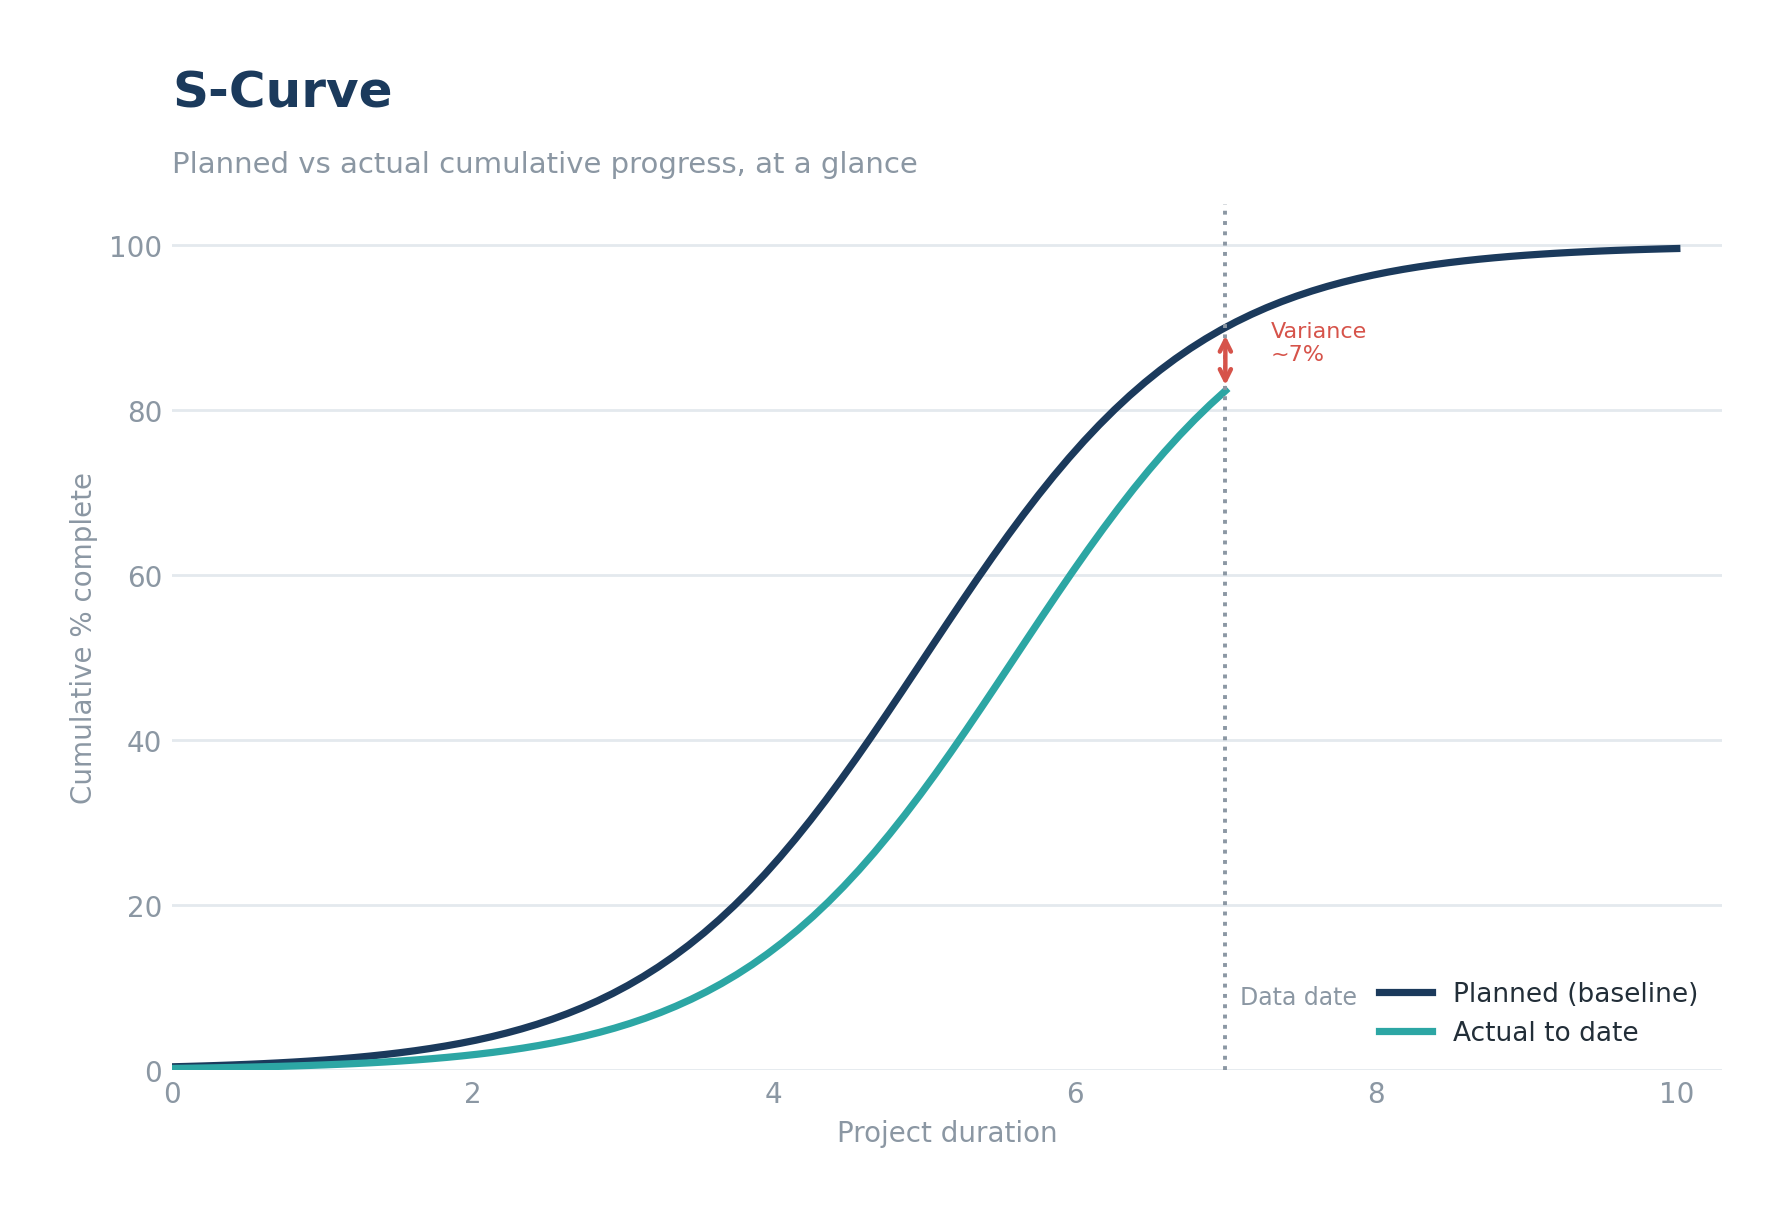
A cumulative progress or cost curve, plotted over time, that typically forms an “S” shape — slow start, rapid middle progress, tapering finish. It’s one of the most widely used tools for tracking planned versus actual progress at a glance.
Why it matters
An S-Curve answers the question “are we ahead or behind, and by how much?” faster than almost any other reporting tool, which is why it’s a standard inclusion in monthly client reports across mining, oil & gas, utilities, and commercial infrastructure projects alike. It can be built on physical progress, cost, or man-hours depending on what the client wants tracked.
What's included in our deliverable
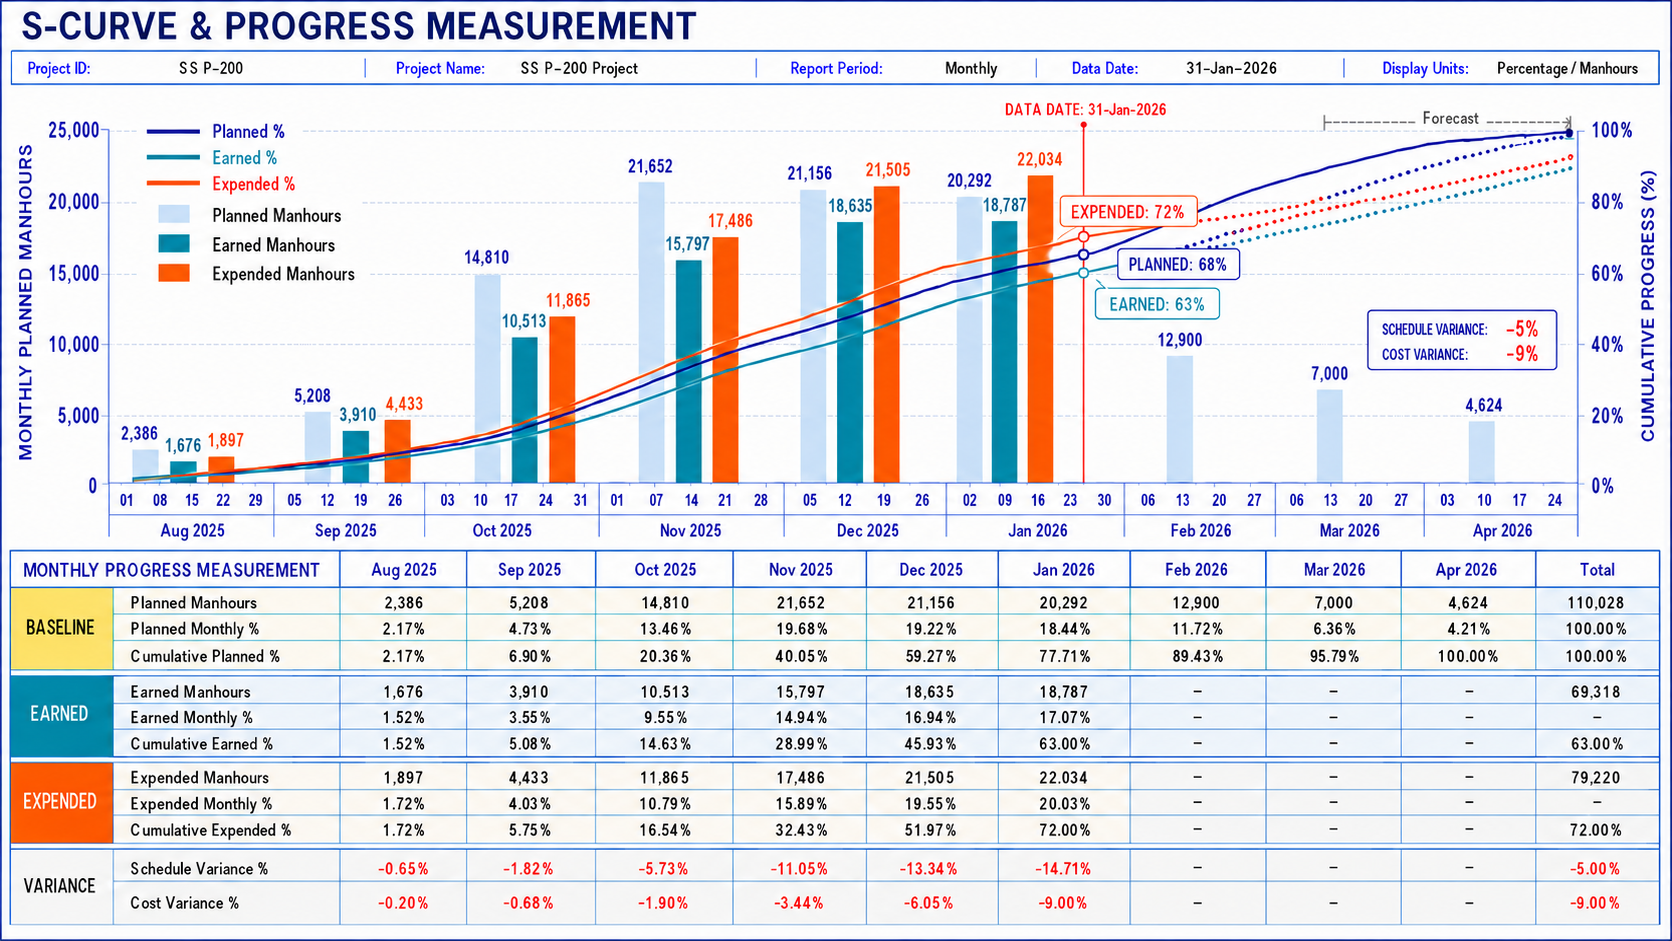
- Planned vs actual S-Curve, updated each reporting period
- Available as progress-based, cost-based, or man-hour-based depending on your contract reporting requirements
- Forecast-to-complete projection based on current trend
When to use it
Every reporting cycle — this is a recurring monthly/fortnightly deliverable, not a one-off.